These BNB metrics suggest a bullish future for the token, but only if…

- BNB has been declining ever since the FUD surrounding the Binance exchange
- BNB’s utility is, however, assured as more users utilize the BNB chain
The Binance [BNB] exchange has been subject to Fear, Uncertainty, and Doubt (FUD), which has contributed to BNB’s recent price drop. However, despite this, the BNB chain has been extremely busy.
Daily active users in web3 ?⤵️
? BNB Chain ~1.1m
? Polygon ~394.5k
? Ethereum ~344.6k
4⃣ Solana ~120.3k
5⃣ Fantom ~58.2k
6⃣ Arbitrum ~58k
7⃣ OpenSea ~54.4k
8⃣ Optimism ~49.3k
9⃣ Uniswap ~44.5k
? Avalanche ~30kHow do these figures convert into fees paid by users? ?⤵️ pic.twitter.com/O6G2osoB55
— Token Terminal (@tokenterminal) December 18, 2022
– Read Binance Coin’s [BNB] Price Prediction 2023-24
– Are your BNB holdings flashing green? Check the Profit Calculator
This chain’s activity stood out as compared to others, and it may provide the foundation for the BNB chain’s eventual revival. When and how might this occur, and what is the relationship between the BNB chain and the BNB token?
Could the daily active users of Binance aid BNB’s rally?
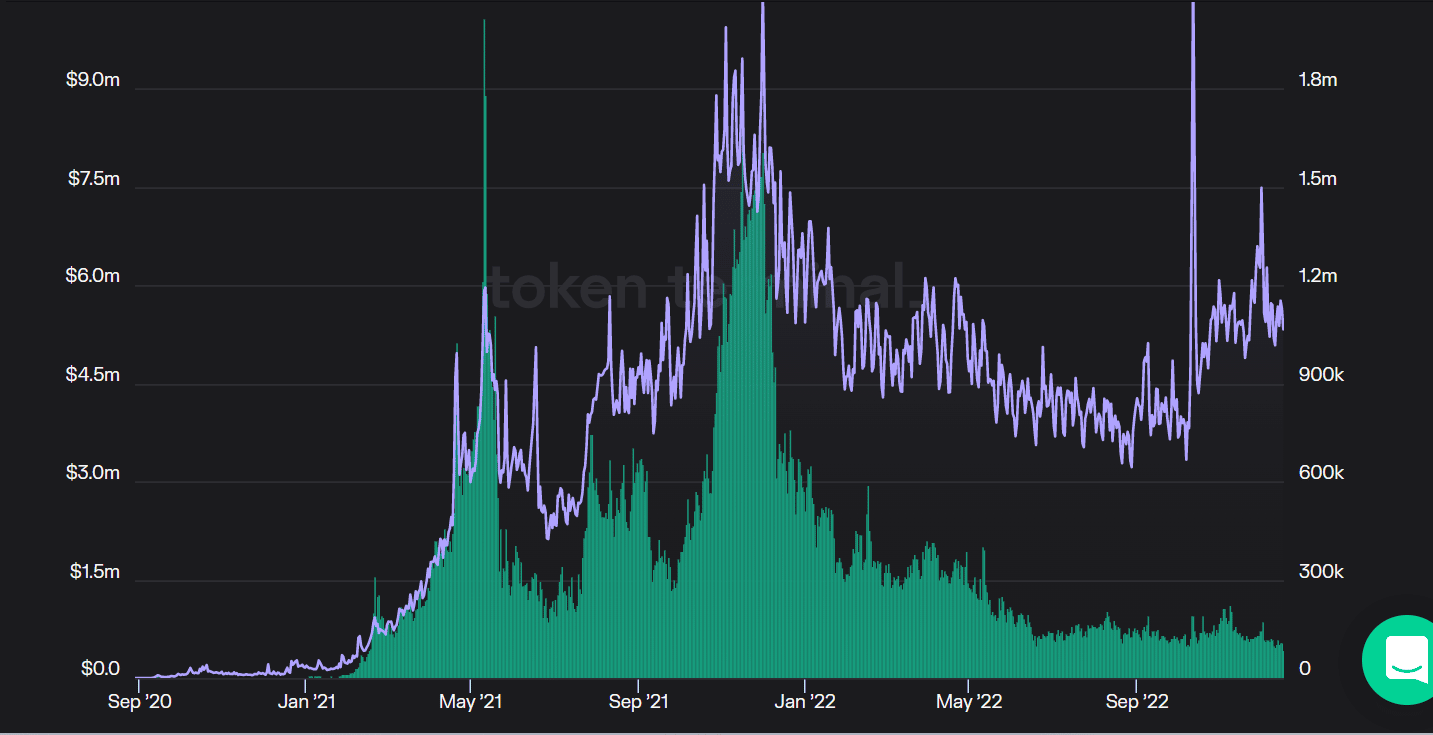
Statistics from the Token Terminal showed that the number of people using the BNB chain each day rose steadily. According to the numbers, the business consistently drew in over a million customers daily. Since BNB tokens are used in all chain transactions, their value will always be supported by the underlying blockchain technology.
For this reason, the coin can now serve a purpose beyond just being a store of wealth.
Furthermore, another statistic that could be gathered was the fees these users had paid. Even though the fees appeared to have decreased due to the changes in the token’s value, it indicated embedded utility. This implied that the token will always be valued because the chain would continue to exist. This was true for both the token and its holders.
– How many BNBs can you get for $1?
– A 5.97x hike on the cards IF BNB hits Bitcoin’s market cap?
BNB rallies, but still bearish
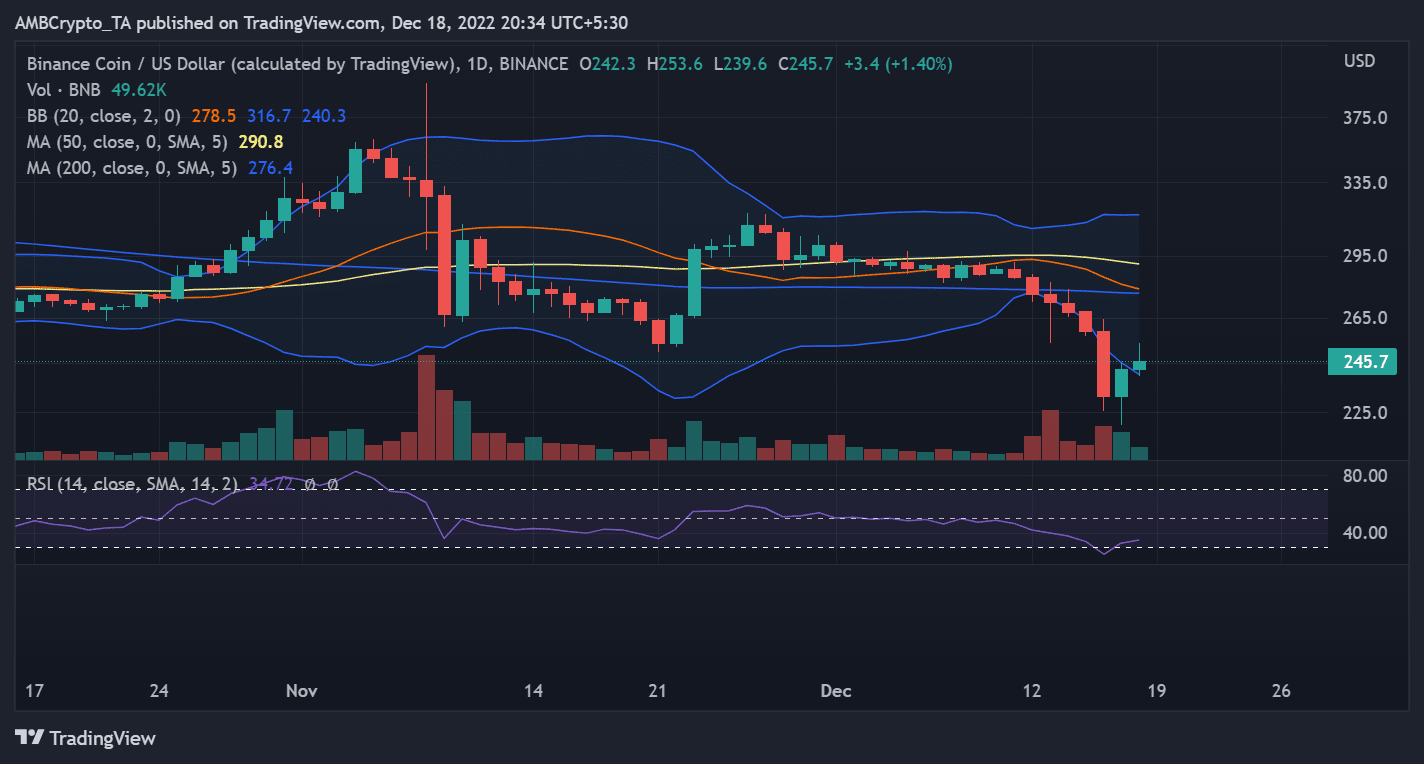
BNB’s daily time frame chart revealed that the token had started bouncing back from its initial slump. At the time of writing, it was trading at about $246, up 1% over the previous trading period, and 6% over the previous 48 hours. The token was still volatile at this time, as evidenced by a look at the Bollinger Bands (BB). Furthermore, the Relative Strength Index (RSI) line indicated that despite the rebound, the overall trend of the token was still bearish.


