Will DOT continue walking on thin ice disregarding Polkadot’s milestone

- Polkadot’s development activity decreased while volume witnessed a surge
- Market indicators suggested that investors should be cautious
Polkadot [DOT] made the headlines yet again, but not because of its development activity. The network distinguished itself from other leading chains by gaining an Altrank score of 1; this is a statistic that illustrates the health and performance of a project.
Read Polkadot’s [DOT] Price Prediction 2023-24
Reaching the score was a major bullish signal, as LunarCrush’s Altrank usually indicates the future of an ecosystem. Avalanche [AVAX] and Polygon [MATIC] stood among the top three of the list.
🔥 @Polkadot stands out of other top chains by being ranked #1 regarding Altrank which is a metric that shows you the health and performance of a project
Let's see closer below to have a better comparison 👇#Polkadot #DOT $DOT pic.twitter.com/ZPqqZobRfa
— Polkadot Insider 🐂⭕️ (@PolkadotInsider) December 3, 2022
DOT also maintained its popularity in the crypto community, as it was on the list of the top coins in terms of social activity in the Polkadot ecosystem. All these developments looked optimistic for DOT and suggested a possible bullish rally in the coming week.
⚡️TOP #Polkadot #DOT Ecosystem Coins by Social Activity
3 December 2022$SAITO $GLMR $FIS $DOT $KSM $DIA $EWT $LIT $ANKR $ONT pic.twitter.com/u2k7ld7uib— CryptoDep (@Crypto_Dep) December 3, 2022
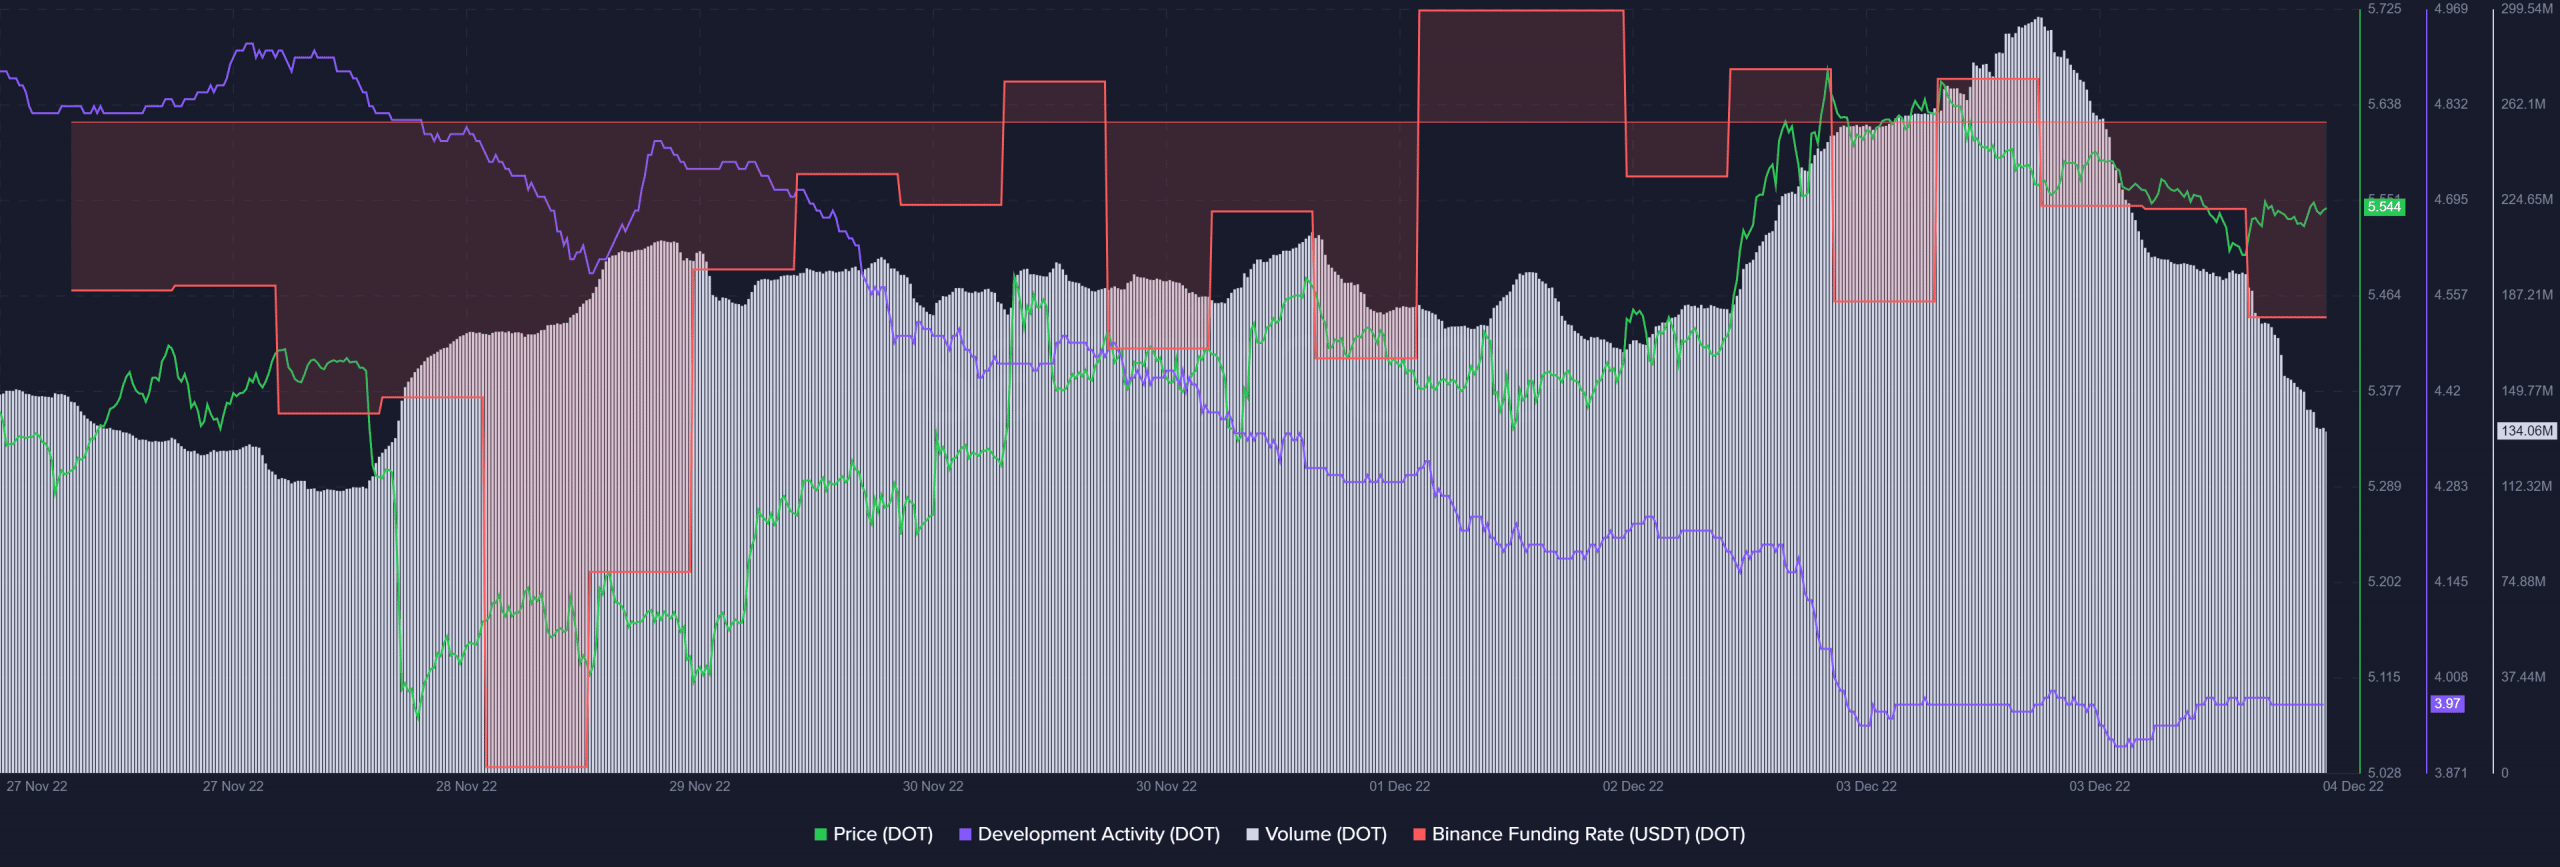
Despite these developments, DOT’s price was down by 1% in the last 24 hours. As per CoinMarketCap, at press time, DOT was trading at $5.54 with a market capitalization of more than $6.3 billion. However, a look at DOT’s on-chain metrics would better depict of what investors can expect from the token in the days to follow.
It’s an environment of caution
Polkadot’s development activity gained southward momentum and decreased sharply last week, which was a negative signal for the network. Though DOT’s Binance funding rate registered an uptick, it was comparatively down, indicating less interest in the derivatives market. Nonetheless, DOT’s volume displayed a surge, which looked promising for the token.
Furthermore, Polkadot’s daily chart revealed an ambiguous picture. Few market indicators were supportive of a price surge while others did not seem optimistic. For instance, DOT’s Moving Average Convergence Divergence (MACD) displayed a bullish crossover, indicating an increase in its value.
The Relative Strength Index (RSI) also went up over the last week and was resting right near the neutral mark. This could be an indication of a northbound breakout.
However, the Chaikin Money Flow (CMF) plummeted. Additionally, the Exponential Moving Average (EMA) Ribbon revealed a bearish advantage in the market as the 20-day EMA was below the 55-day EMA.