BNB surpasses ETH on this front, but can Binance Coin investors truly rejoice

- BNB outperformed Ethereum in terms of TVL
- BNB’s latest partnership in the GameFi space could give BNB a much-needed push
Binance Coin [BNB] outperformed Ethereum [ETH] yet again in terms of its total value locked (TVL). According to BNB’s official tweet, its TVL increased slightly this quarter at 8.22%, compared to Ethereum’s increase of 0.45%.
TVL increased slightly this quarter at 8.22%, compared to Ethereum’s increase of 0.45%.
[11/12] pic.twitter.com/ec1bl4wlAo
— BNB Chain (@BNBCHAIN) December 11, 2022
While BNB’s TVL took a northward route, the coin’s price action was not up to the mark as it registered negative 5% seven day gains. According to CoinMarketCap, at press time, BNB was trading at $281.38 with a market capitalization of more than $45 billion.
However, the scenario might soon change in favor of BNB, as CryptoQuant’s data revealed a major bullish signal.
Read Binance Coin’s [BNB] price prediction 2023-2024
Assessing the state of BNB
As per data from CryptoQuant, BNB’s stochastic was in an oversold position, suggesting the possibility of a trend reversal. Furthermore, BNB’s partnership with LitLab Games could push the BNB token on the price front.
? @LitLabGames announced a partnership with @BNBCHAIN to boost the game development into the blockchain ecosystem!
LitLab Games is the first Esports developer & publisher launching games backed by blockchain technology with a #Crypto-based economy.#BNB #BSC #Web3 $LITT $BNB pic.twitter.com/6sPOzb002h
— BNB Swap (@BNBSwap) December 11, 2022
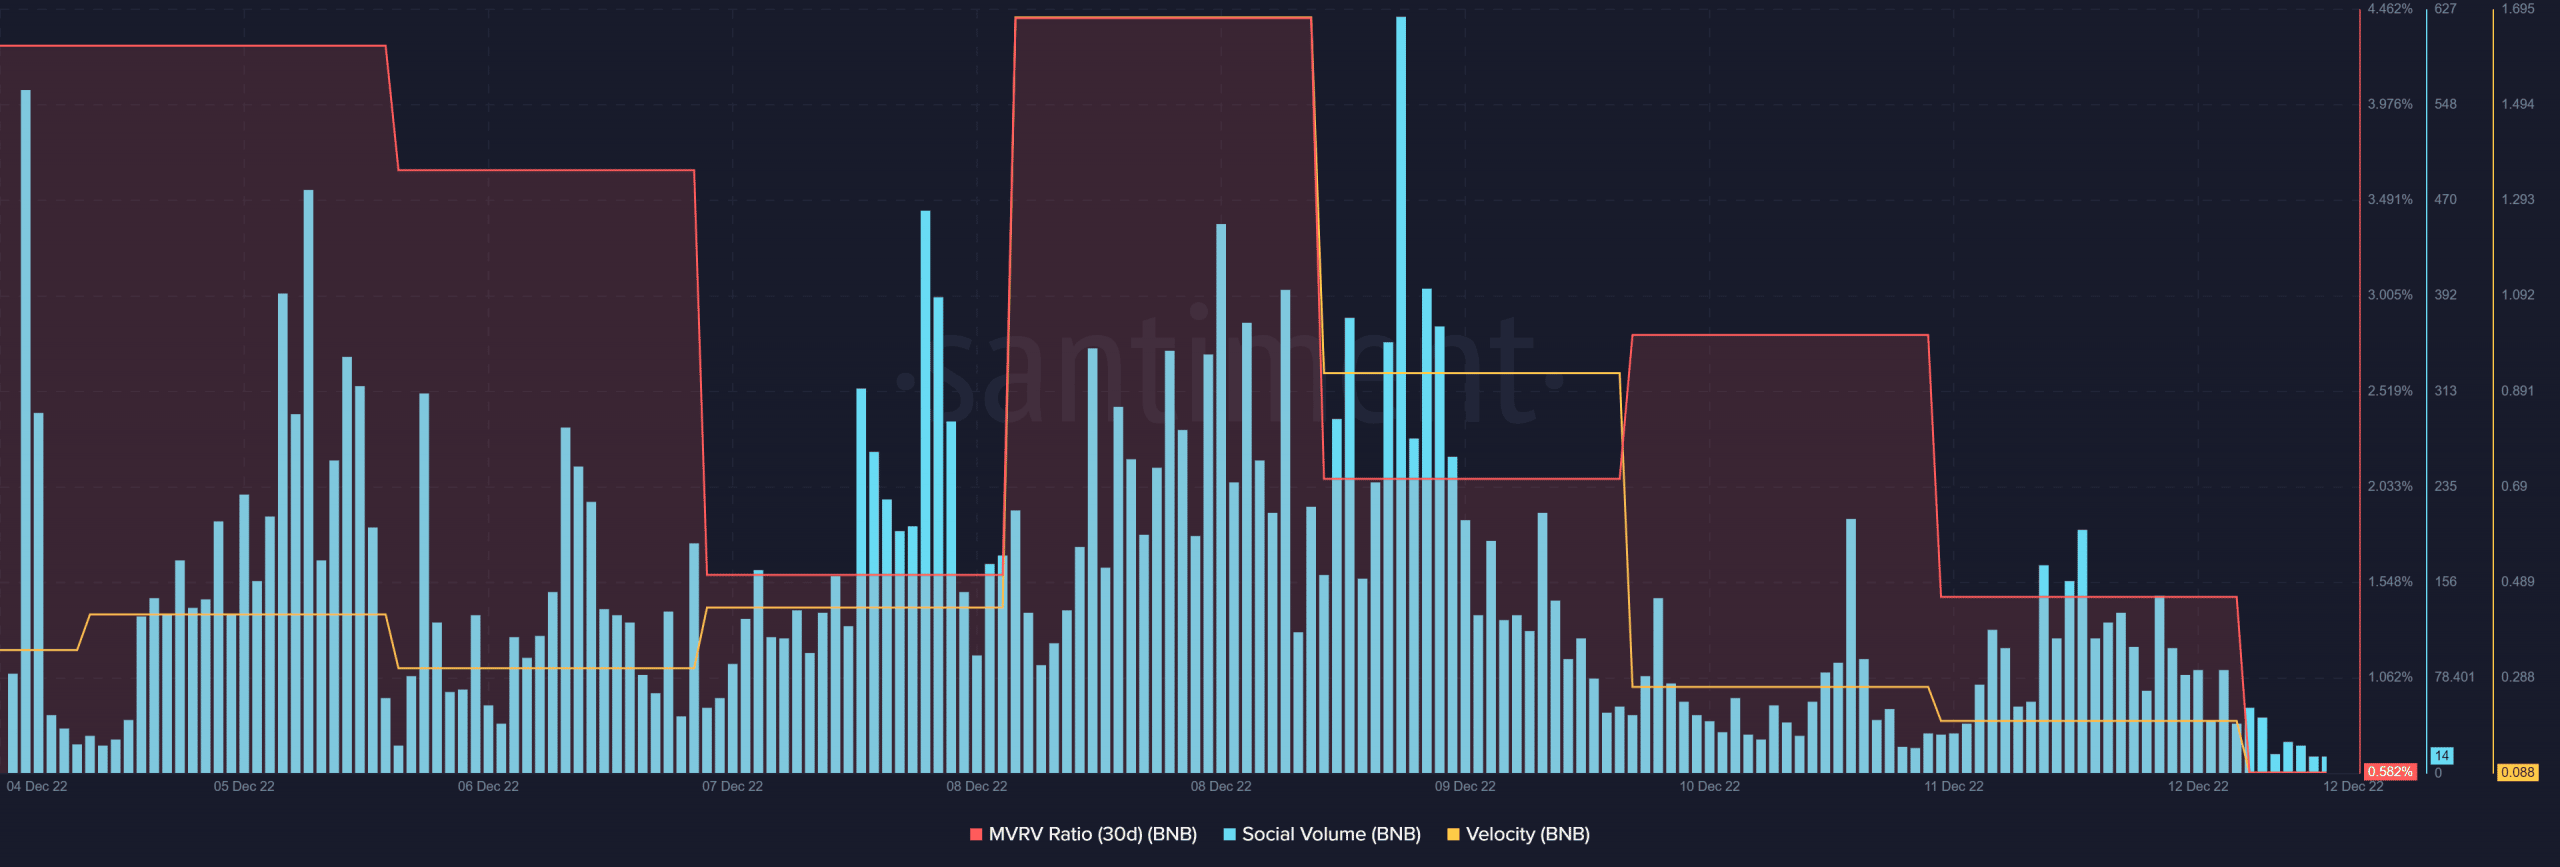
Data from on-chain intelligence platform Santiment also favored BNB, and inclined towards investors’ interests. BNB’s Market Value to Realized Value (MVRV) Ratio was considerably lower, possibly indicating a market bottom.
BNB also remained popular in the crypto space as its social volume spiked last week. Nonetheless, BNB’s velocity chose to move southward, which might be concerning.
Does BNB run with the bulls?
BNB’s daily chart revealed that the bulls and the bears were fighting to beat each other. For instance, the 20-day Exponential Moving Average (EMA) and the 55-day EMA were closely knit, displaying an on-going tussle.
The same was the case with the Moving Average Convergence Divergence (MACD). The indicator was similar to that of the EMA Ribbon. BNB’s Chaikin Money Flow (CMF) registered a slight decline, which was a bearish signal.
However, the Money Flow Index (MFI) saw a rebound and was headed upward. This suggested a possible trend reversal in the days to follow.


