As Tron joins the 4 billion transaction count club, this is where TRX is headed

According to data gathered from Tron blockchain explorer, Tronscan, the total amount of transactions on the TRON network reached and surpassed $4 billion. The network’s ability to offer lower transaction fees with faster speed than Ethereum [ETH] was one of the factors that contributed to its popularity.

A serene and stable metric front
Messari reported that the TRON network stood sixth among the most valuable smart contract platforms. Tron’s market valuation also stood at $6 billion. This was behind the likes of Ethereum, Cardano, and Polkadot.
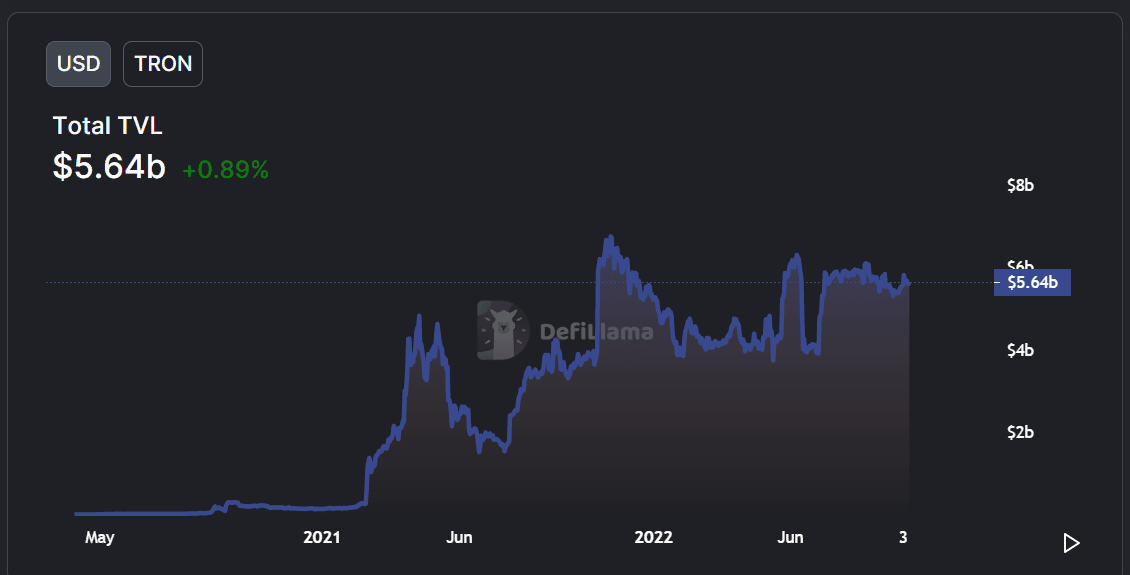
Furthermore, data acquired from DefiLlama showed that the network had a Total Value Locked (TVL) of more than $5.6 billion. Additionally, he TVL surged by 0.89% in the past 24 hours.
The TVL dropped to around $3 billion in June before rising to above $5 billion and stayed there in recent months. This is depicted in the image below.
Price sets a good mood
Observing the price chart on the daily timeframe, it could be seen that TRX had been meeting resistance at the area of $0.0658, where the 50 Moving Average (MA) and the 200 MA had both also acted as resistance levels.
A descending triangle may be seen using the trend lines, and using the price range tool, it was possible to observe that the price had declined by more than 37% since the start of the decline. The support range was also seen between $0.0599 and 0.0576.

Breaking above the MAs that have been acting as resistance, especially the long MA, would signal the start of a potential uptrend. After breaking through the $0.0658 barrier, TRX could make a test of the level where the descending triangle trend began. This would be at $0.0894, for a gain of nearly 37%.
The asset’s low volatility was also reflected in the narrowing of the Bollinger Band (BB). In accordance with the MA’s confirmed observation, a breakout above the band’s upper band will usher in a bull run for the asset.
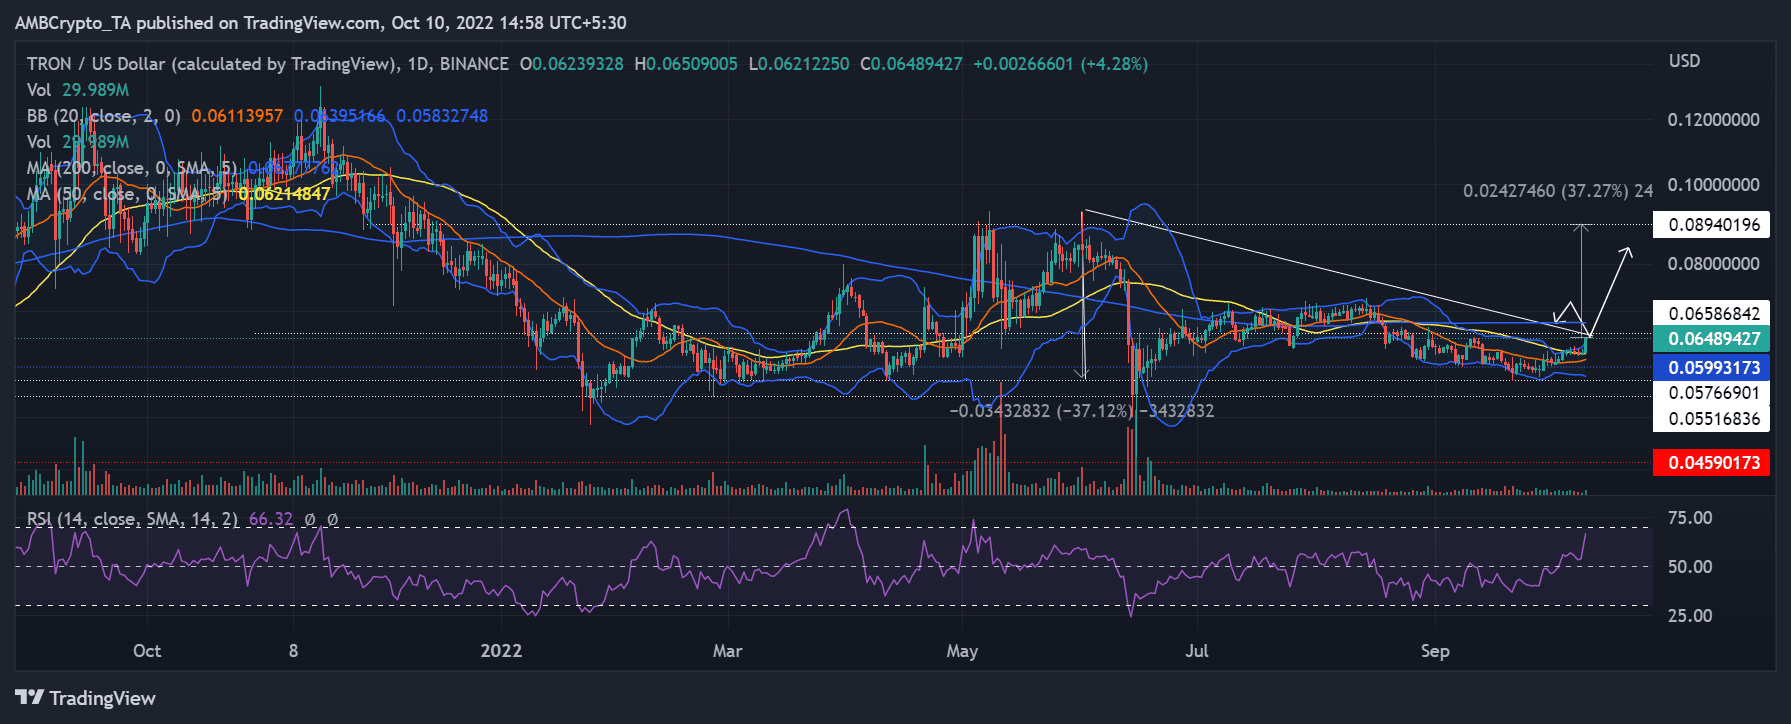
With an opening price of $0.0623, TRX gained more than 2% in the trading period and was trading at $0.063. The Relative Strength Index (RSI) showed the line above the neutral line signifying a bullish trend on the daily timeframe. It could also be observed that the line had an upward inclination, signifying a potential move to the overbought zone.
If the present upward trend on the chart continues, a break of the short MA resistance level is possible. At this juncture, investors should be on the lookout. Crossing of the short MA above the long MA could lead to a buying opportunity for the asset, whether for the long or short term.