Binance Coin, MATIC, Waves Price Analysis: 08 September

As Bitcoin and Ethereum slumped, many altcoins followed suit. Binance Coin, MATIC and WAVES declined sharply on their charts. Binance Coin, following its 17.1% plunge traded near its multi-week low at $386.83.
MATIC fell below its one-month long support line of $1.38, after a 20% fall since yesterday. WAVES too was positioned below its one-week low of $27.05.
Binance Coin (BNB)
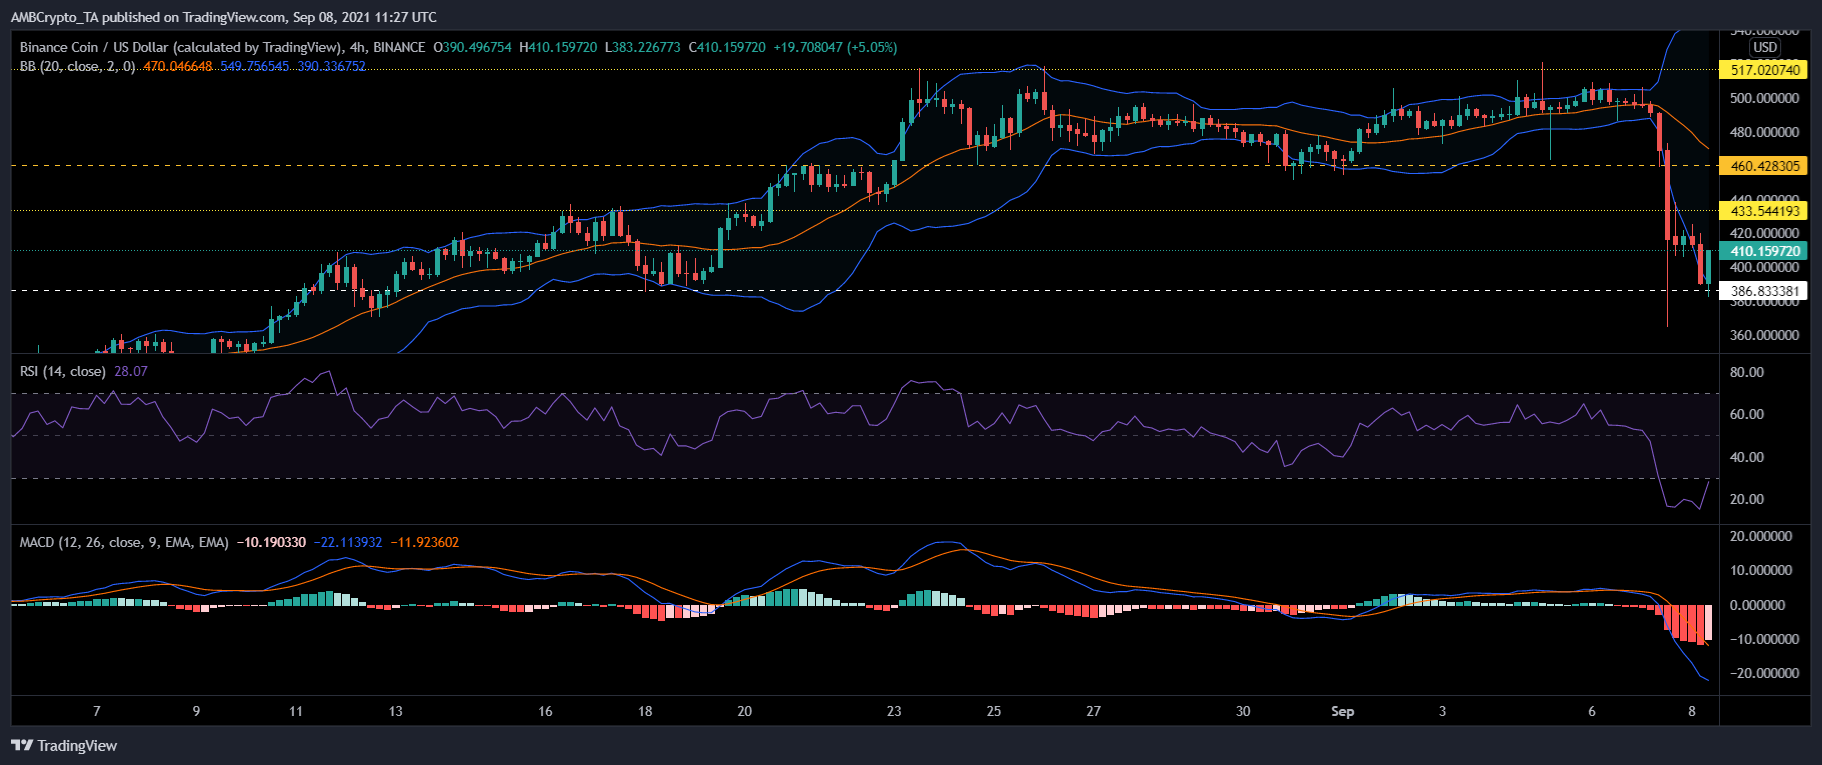
BNB crashed by 17.1% over the last 24 hours and was trading at $410.15, near its multi-week low of $386.83. The technical indicators were bearish at the time of writing.
Relative Strength Index was positioned below the oversold zone, despite the crypto coin making an attempt to recover from the oversold condition. The indicator was at a multi-month low. MACD displayed red bars on its histogram.
Bollinger Bands diverged heavily, an indication that prices might expect high volatility. If buying strength revives, BNB can find immediate resistance at $433.54. The additional resistance levels lay at $460.42 and then at its multi-month high of $517.02.
Polygon (MATIC)
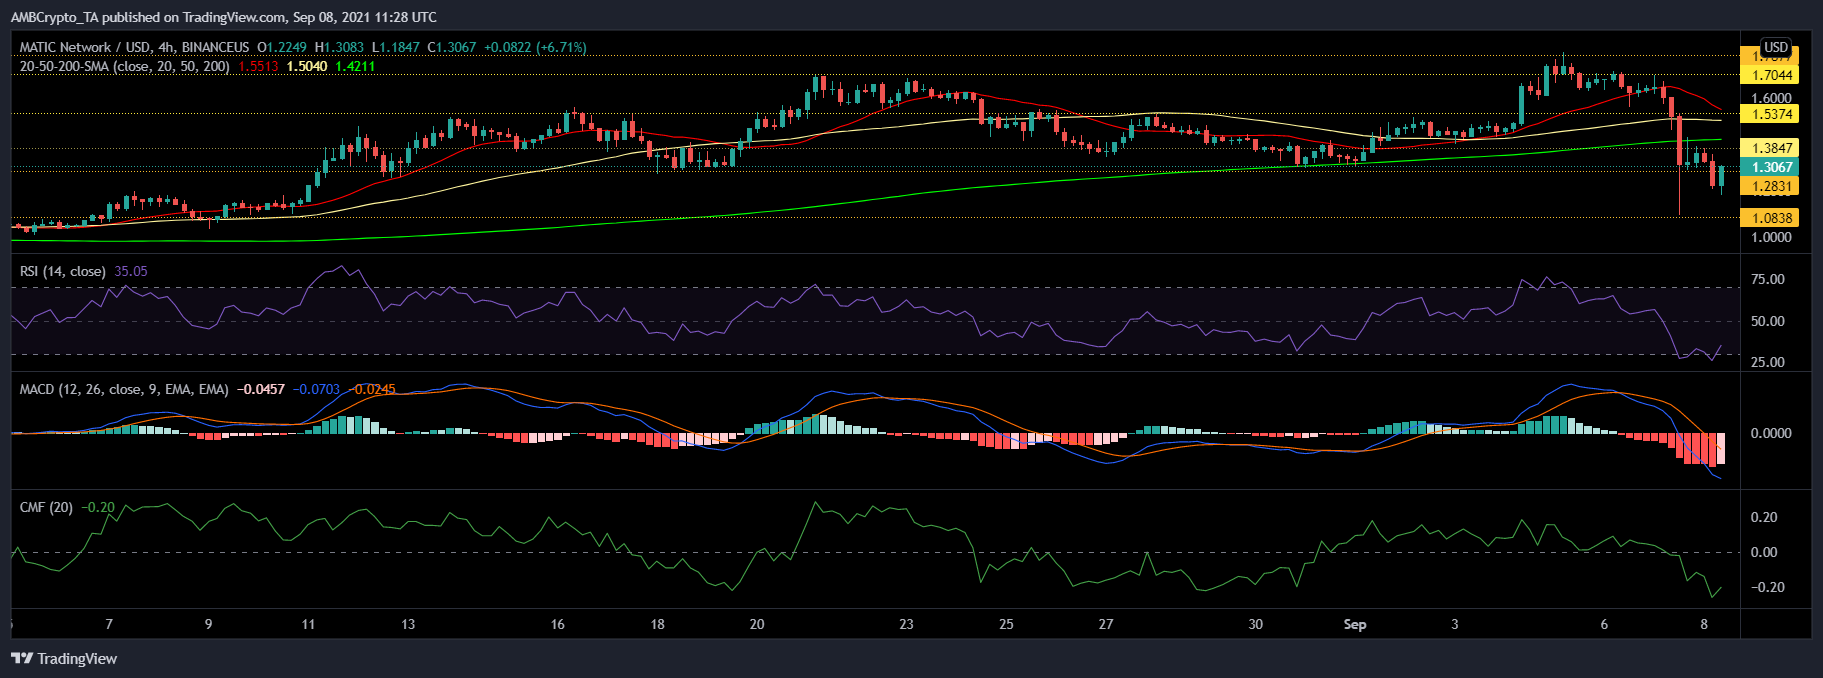
MATIC plummeted by a sharp 20% over the last 24 hours and was valued at $1.30. It broke below its nearly month-long support region of $1.38. The next support level lay at $1.08.
The asset was trading below its 4-hour 50 SMA, which signifies a strong trend. Other key technical indicators also pointed towards negative price action.
Relative Strength Index was parked inside the bearish zone, although the coin made a slight recovery and stood above the oversold territory. MACD displayed red bars on its histogram.
Chaikin Money Flow also corresponded to the bearish pressure as it stood below the mid-line following a fall in capital inflows.
On the upside, MATIC can push above the $1.38 price ceiling and then trade near the $1.53 price level. Toppling over the aforementioned resistance mark, it could revisit its multi-month high of $1.77.
Waves (WAVES)
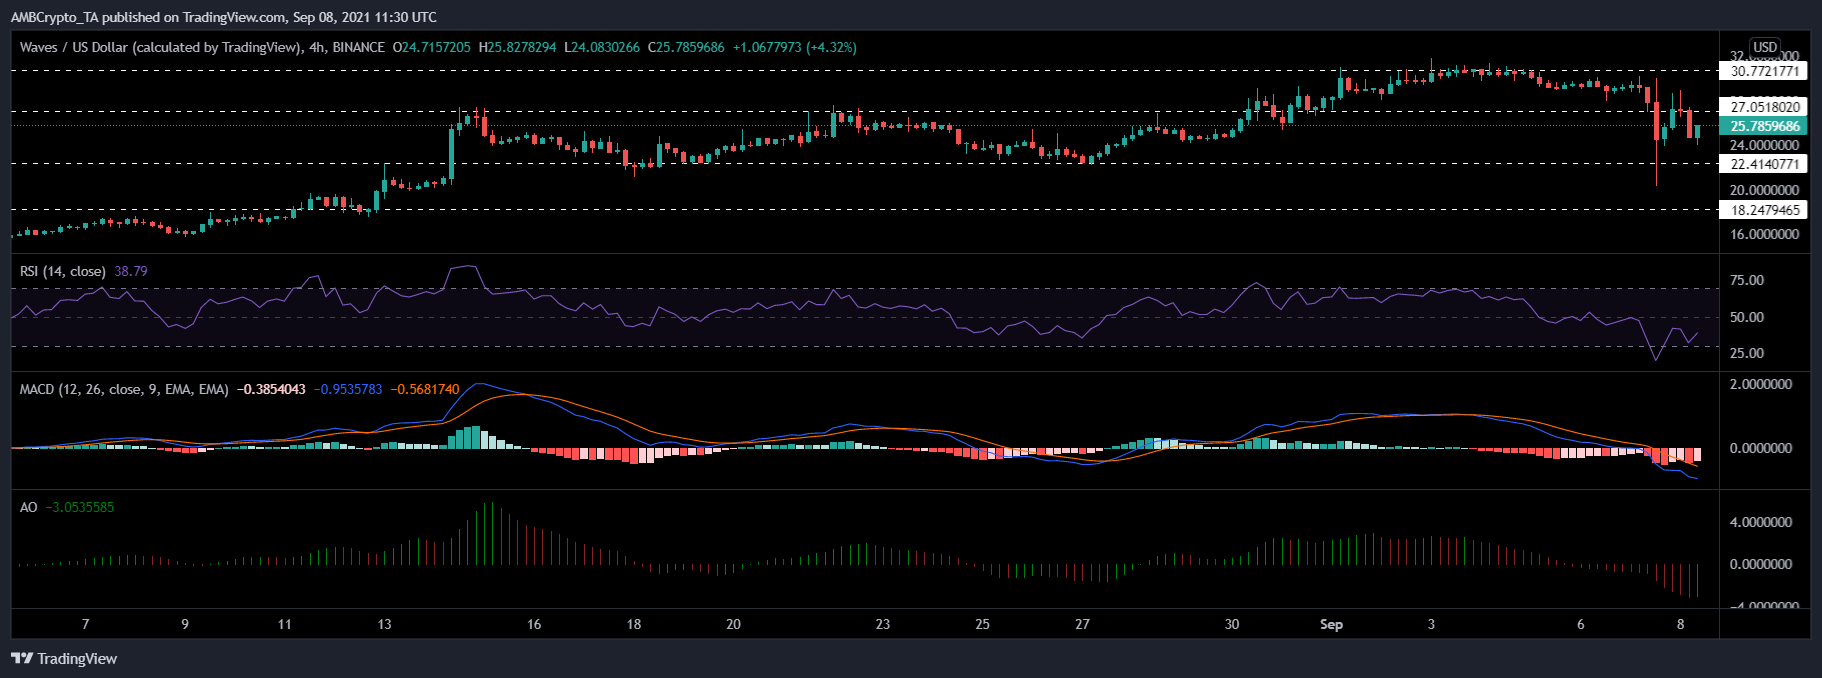
WAVES noted over 10% decline in the last 24 hours, and was priced at $25.78. It broke below its support level of $27.05.
At the current price level, WAVES has been trading at a one-week low price mark. Dipping further below could mean that the altcoin traded near its four-week low of $22.41. Its additional support level rested on $18.24.
Indicators remained bearish, as the Relative Strength Index stood below the half-line. Buying pressure remained considerably low. MACD flashed red bars on its histogram.
Awesome Oscillator depicted a series of red bars, but also a green signal bar, as the asset’s previous trading session was in green. If prices move to the upside, the first resistance level for WAVES, lay at $27.05 and then it will revisit the multi-month high of $30.77.