This ‘never seen before’ Bitcoin trend can lead to ‘further downside’

Bitcoin, after sustaining itself above the $32.5k-level with a steady sideways movement for most of July, saw a surprise hit below this support on 14 July. This swift drop towards the crucial $30k level raised alarm among bulls and bears alike as the larger market saw a shift from weak hands to strong hands.
Another alarming metric highlighted Bitcoin mentions on crypto social media falling, with its 7-day moving average sinking to a half-year low. Amidst these concerns, a faint light glimmered in the dark with the return of whales and miners to the space. ByteTree CEO James Bennett recently underlined his mixed predictions for BTC’s future.
Bitcoin’s price, as this week opened, had stabilized above the $33K level due to a reduction in miners selling and increased accumulation. However, Bennett painted a different picture and warned that a bunch of other metrics point towards decreased activity on the network. He hinted that Bitcoin is still stuck in a neutral zone and suffers from reduced appetite from key players.
The analyst further pointed out that weekly Bitcoin transactions have been on a sharp downturn since April. Ongoing market downturns and drop in transactions further led to a fall in the total value transacted on the Bitcoin network. At the time of writing, the total value transacted (1-week cumulative, rolling) stood at $23.9 billion, the lowest level seen since December 2020.
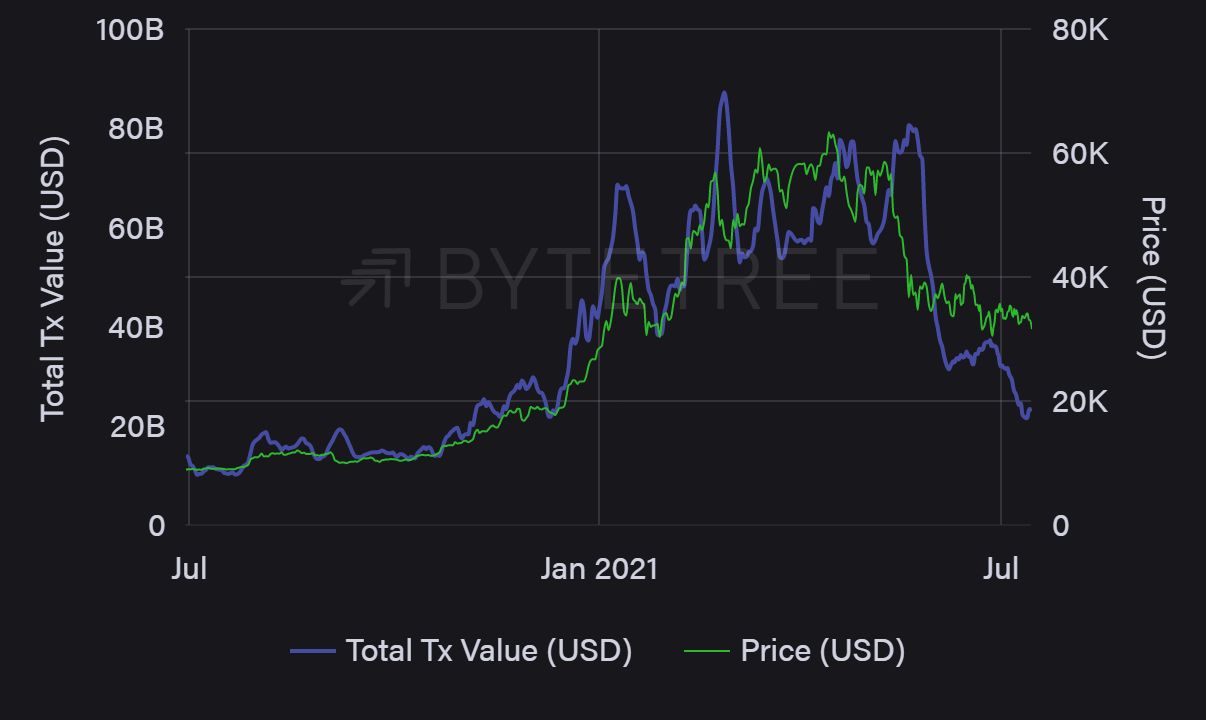
The analyst further highlighted that due to a decline in on-chain activity, it was unlikely that Bitcoin will move north anytime soon. He said,
“It’s unlikely that Bitcoin will see its next price move up and it may even see a move to the downside.”
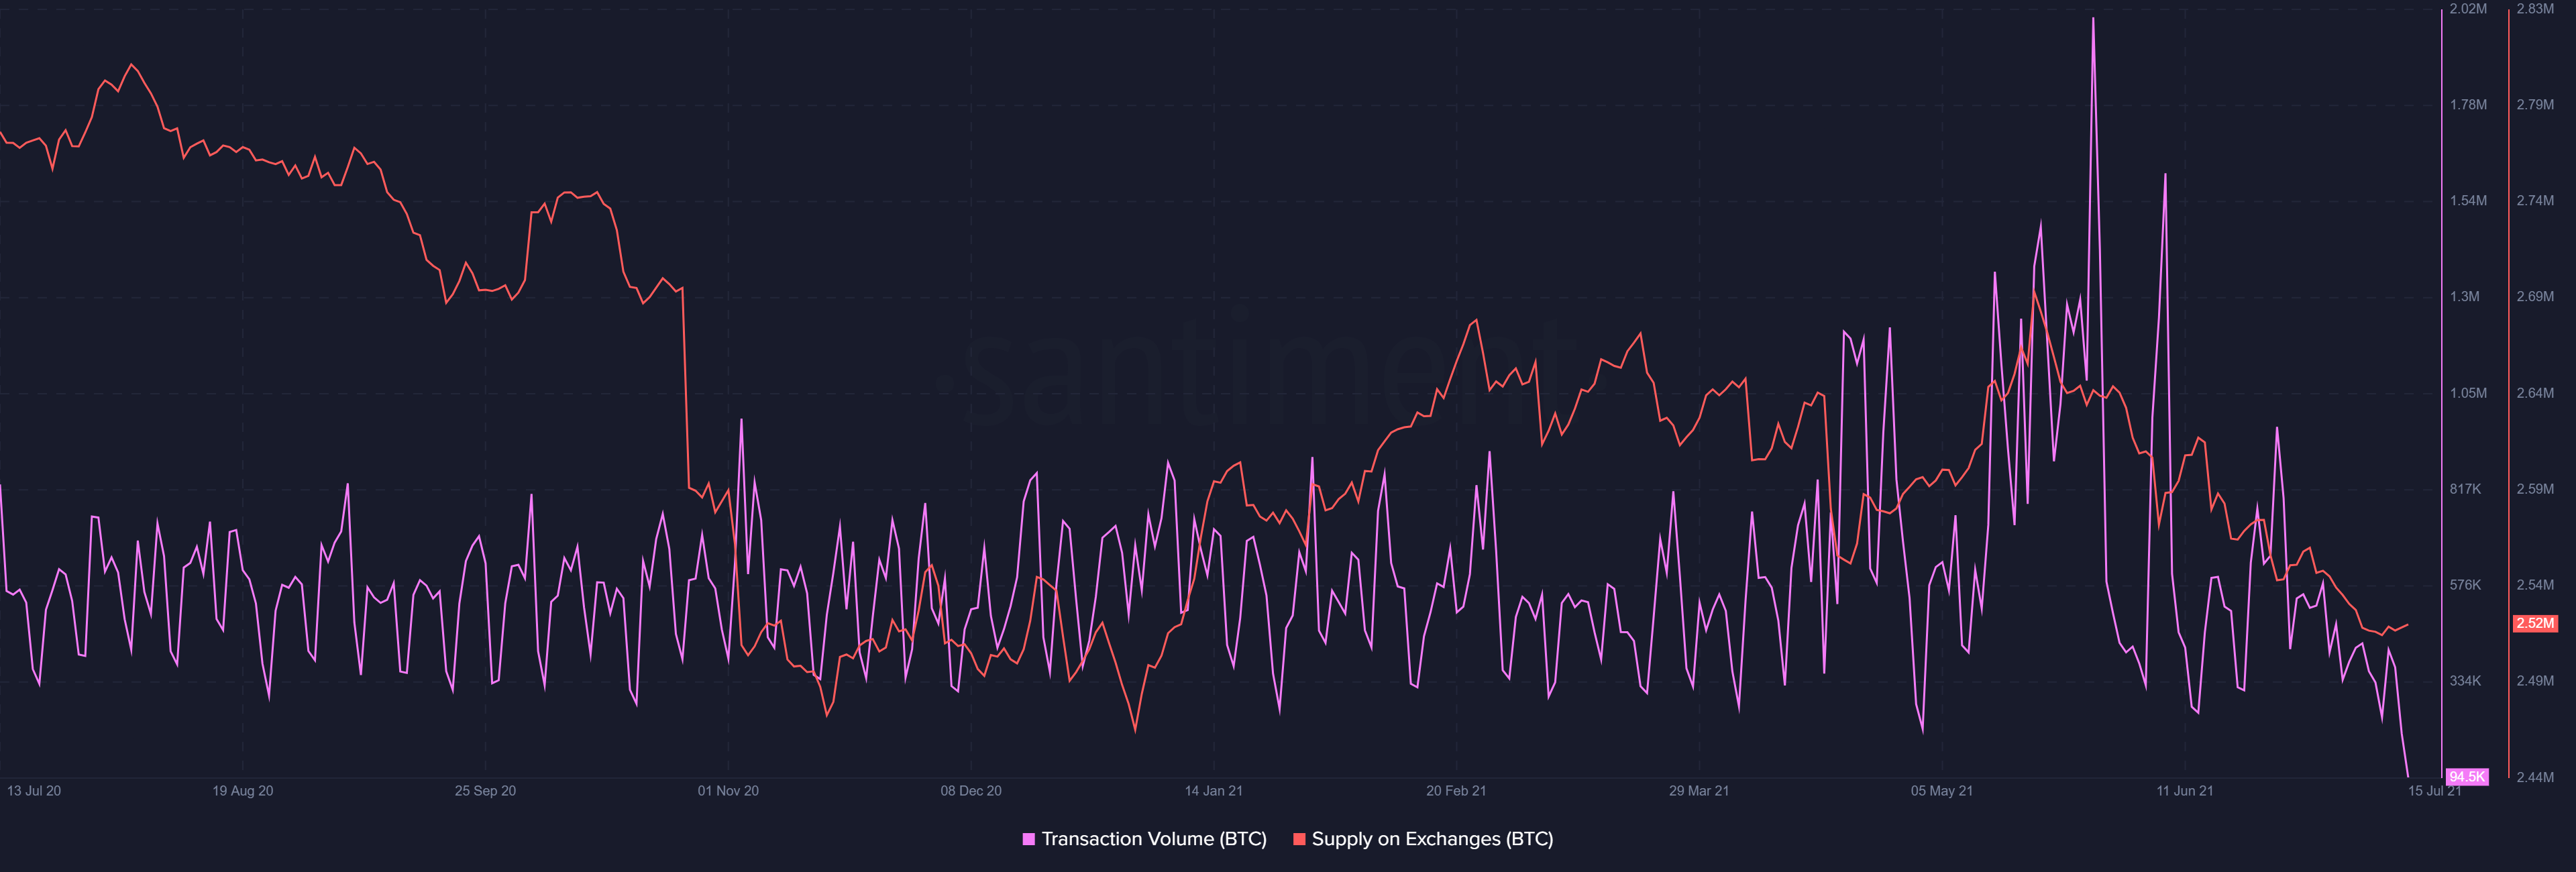
Market dormancy was also spotted in transaction volumes with supply on exchanges, which pointed towards low activity for BTC, especially in the spot market. As of 14 July, the supply on exchanges was 2.52 million – The lowest since January this year.
Further, Bitcoin velocity hit an all-time low of 195% on 11 July. However, an uptick in the same brought the indicator to 215%, at the time of writing. The 11 July drop was a major decline from its 23 May high of 593%. About this, Bennett said,
“In the second half of last year, July through to December, velocity was picking up, and subsequently price followed. As velocity has fallen through the year, the price has followed again.”

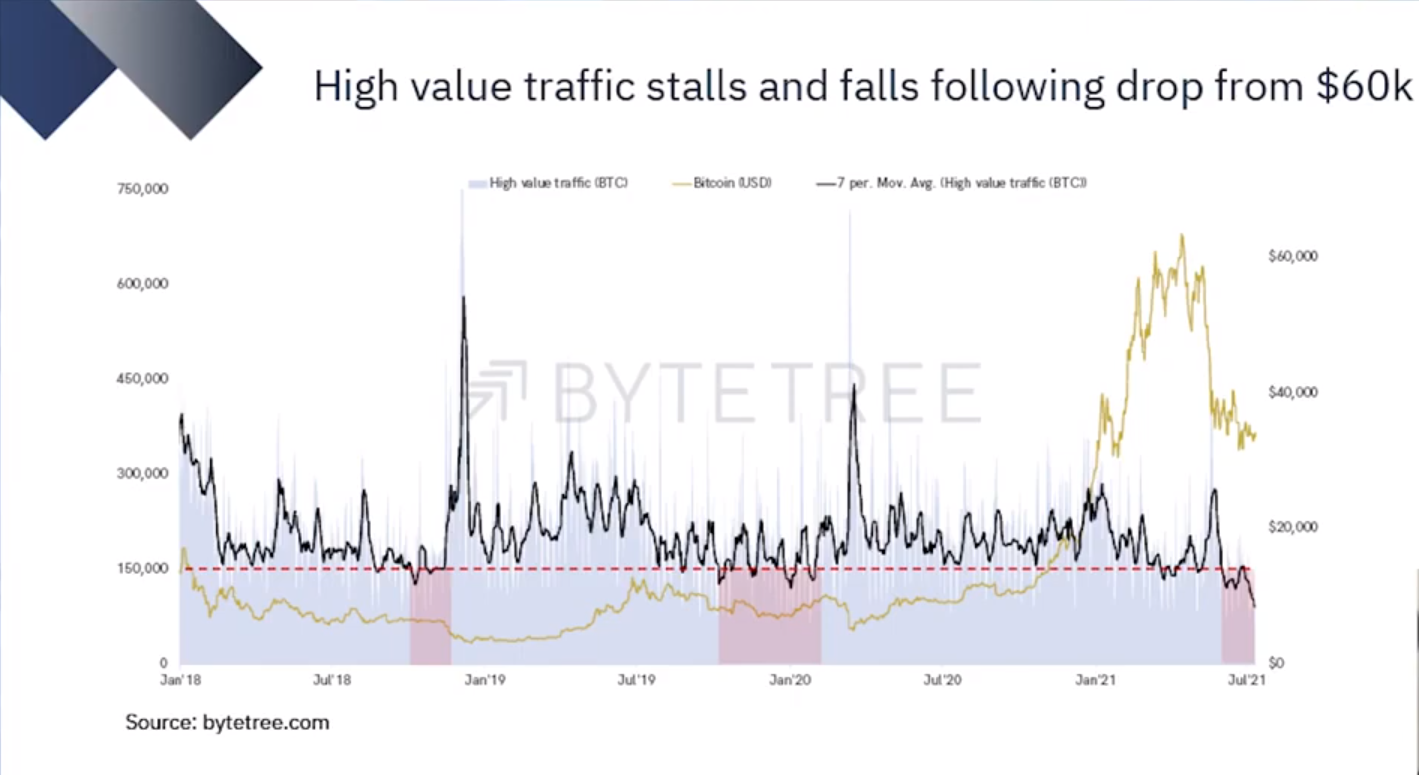
The analyst also pointed out another “never seen before trend” for Bitcoin, one where on a high-value traffic 7-day moving average chart, the indicator was seen falling below the 150K Bitcoin line in the high-value bucket.
Here, it’s noteworthy that each time the indicator fell below that range, Bitcoin’s price showed weakness, as seen towards the end of 2018 and 2019. What’s more, that high-value traffic was also a major driver of the last bull market.

![Bittensor [TAO]](https://ambcrypto.com/wp-content/uploads/2026/07/Gladys-19-e1784100557377.jpg)