Why ATOM might fail to form stronger bonds despite favorable conditions

Cosmos’ [ATOM] popularity witnessed a surge very recently. According to the crypto analytics platform, CoinGecko, it was among the top cryptocurrencies in terms of trending searches.
Not only this, but several positive developments happened in the Cosom ecosystem that painted a bright picture for ATOM.
⚡️Trending Searches by @CoinGecko
11 October 2022$EVMOS $OP $GMX #BNBChain $BNB #BNB $NEAR #NEAR $MATIC $ATOM $MAGIC $HT $LUNA pic.twitter.com/x91NBRhRZH— CryptoDep (@Crypto_Dep) October 11, 2022
According to the data analytics platform, Messari’s latest tweet, ATOM 2.0 and the addition of liquid staking will allow ATOM stakers to both increase security for the Hub and improve liquidity across the ecosystem.
This development looked promising as it added significant value to the network. Interestingly, despite paying higher fees to protocols, ATOM’s revenue remained stagnant.
ATOM 2.0 and the addition of Liquid staking will allow $ATOM stakers to both increase security for the Hub and improve liquidity across the ecosystem.
Will these changes bring value back to ATOM holders? @cosmos pic.twitter.com/q4QmZQ5Wyk
— Messari (@MessariCrypto) October 12, 2022
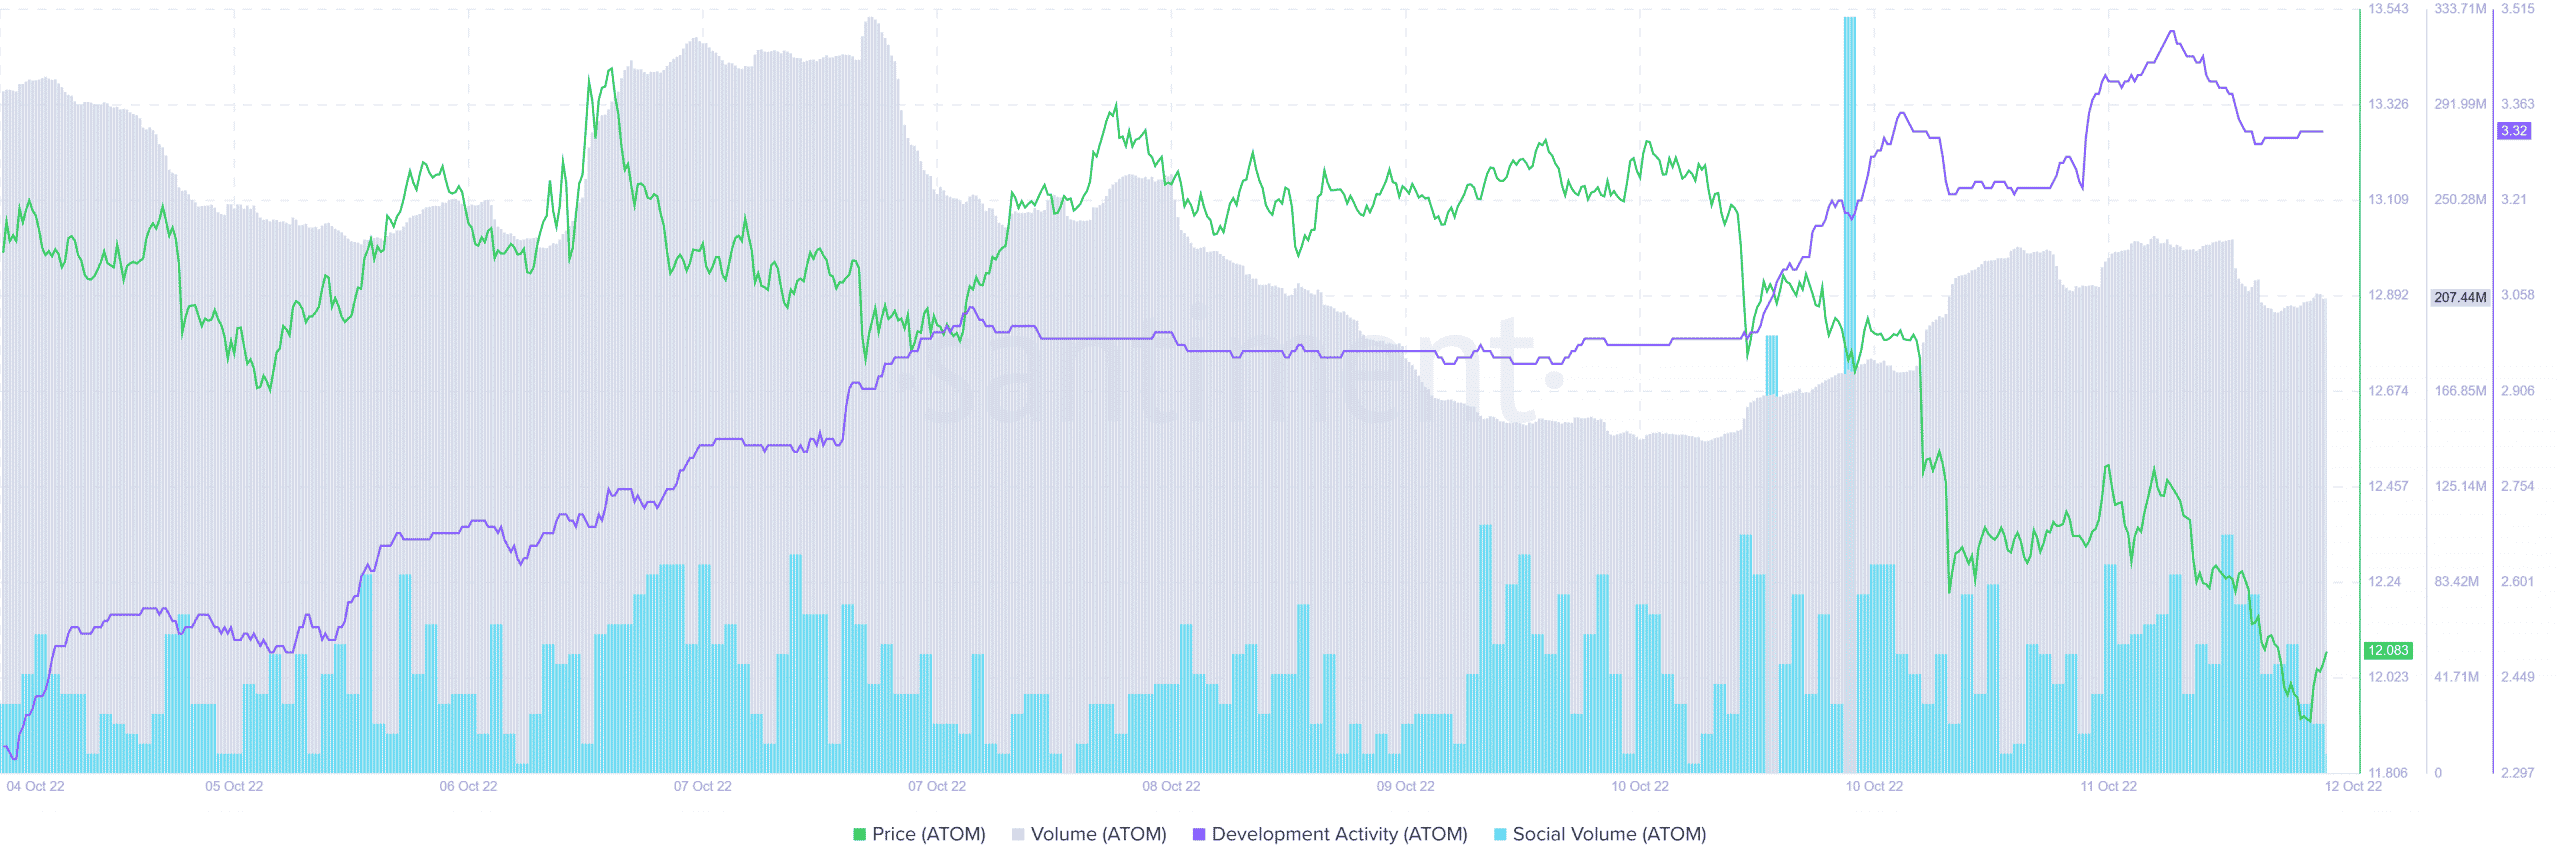
ATOM’s price also did not correspond to the positives as it registered negative 7% growth in the last week. At press time, ATOM was trading at $12.06.
However, a look at ATOM’s on-chain metrics told a different story. Despite the fact that ATOM was struggling to climb the ladder, most of the metrics were in ATOM’s favor.
Here’s AMBCrypto’s Price Prediction of Cosmos (ATOM) for 2023-24
Look both ways
Apart from the aforementioned developments, ATOM also topped the list of IBC (Inter Blockchain Communication) projects in terms of weekly active users. This episode proved the increased popularity of ATOM in the crypto community.
Top #IBC Projects by Weekly Active Users 🔥
🥇 $ATOM @cosmos
🥈 $OSMO @osmosiszone
🥉 $EVMOS @EvmosOrg$CRO @cronos_chain$LUNA @terra_money #CroFam @cryptocom$UMEE @Umee_CrossChain$SCRT @SecretNetwork$MNTL @AssetMantle$EROWAN @sifchain#IBCGang #Cosmonauts@MapOfZones pic.twitter.com/FiGvYMMW8V— TKResearch Airdrop (@TKRAirdrop) October 11, 2022
Incidentally, despite the recent price drop, ATOM’s volume took the opposite route and increased over the last week, which was a plus point for the blockchain.
Though ATOM’s development activity dropped slightly on 12 October, it was considerably up when compared to the previous week. As indicated by CoinGecko, ATOM’s popularity was yet again proven after its social volume spiked in the last week.
Accident-prone ATOM?
Surprisingly, while ATOM’s on-chain metrics were quite positive, its daily chart painted a bearish picture as most of the market indicators suggested a price plummet in the days to come.
For instance, ATOM’s Relative Strength Index (RSI) and Chaikin Money Flow (CMF) both stayed quite below the neutral line, a clear bearish indicator.
Furthermore, the Moving Average Convergence Divergence (MACD) also painted a similar picture. The MACD favored the sellers.
The Exponential Moving Average (EMA) Ribbon displayed a tussle between the bulls and the bears. However, when putting together all the indicators, the possibility of the bears turning out to be victorious seemed more likely.


